Our research addresses one of long-term issues in regional economic development: how do some regions manage to develop new economic activities while others fail to do so? We focus on regional knowledge that is arguably reflected by its industry structure. Using the inter-product proximity measure as a tool to analyse the evolution of industries at province level, our research finds that products that are close to provinces’ portfolios have a higher success probability, allowing them to emerge and thrive in those provinces, whereas products that are less related to its provinces’ portfolios tend to decline and fail. Moreover, simulation of product transition demonstrates that there is a threshold value to relatedness that could explain why some provinces fail to develop new products and eventually suffer from stagnancy. Industrial policies should address this stagnancy by facilitating products that are more related to the provinces’ portfolios.
Here, using international and regional trade data we demonstrate how to quantify inter-product proximity, construct product space, and simulate how regions evolve to different paths.
Measuring product proximity
In measuring product proximity this study adopted the proximity method introduced by Hidalgo et al. (2007). Their measure of product proximity is based on the co-occurrence concept of two products being exported by a country in tandem. Formally, proximity between product i and j is defined as ‘the minimum of the pairwise conditional probability of a country exporting a good, given that it exports another’. Illustration of how product proximity is calculated, proximity matrix and its properties, and sample of product proximity are provided below.
Illustration: how product proximity is calculated. Consider a country exports apples and pears together. There is nothing can be said whether apples and pears are two related products. However, if 150 out of 200 countries which export apples also export pears together, it is likely that apple and pear are somehow related product, i.e. having close proximity. The probability of countries to export a product conditional it exports another product is then called proximity between the both products. By calculating this probability for the whole products exported by all countries, we can develop proximity matrix of products.


Constructing product space
Using the value of product proximity, we then constructed what is called product space. Product space is network representation of proximity matrix where products and their values of proximity were referred to as nodes and links respectively. The network builder software, Cytoscape, offers the edge-weighted spring-embedded layout that is considered to be the most suitable layout to reveal the product space structure. For its size, depicting all the nodes into the network of product produces a very dense, crowded network which does not help the analysis at all. After some experimentation with various cut-off values, it was decided that the best visual representation of the network structure emerged with a cut-off proximity value of 0.4. This means that only those links with proximity values greater or equal to 0.4 were included into the network. In order to enhance the legibility of the graphs, information about the position of products within the product space was added through colour-coding different industry groups. Furthermore, we depicted the proximity information in the product space by the degree of transparency of the links. The rule was that the darker links represent higher proximity (i.e. closer products). In addition, the total export values of the products were represented by the size of the nodes. Larger size of the nodes indicates greater export value of the products in the global trade.
The Product Space

Using the product space as a template, we construct regional product space by depicting province exports onto the network. To reveal the evolutionary changes of regional industries, regional product spaces are constructed at two points of time, i.e. year 2000 and 2012. Here are two examples of provinces’ product space. We provide the complete provinces’product spaces in the Product Space.
Provinces’ Product Spaces:
West Java (A) & Central Java (B)
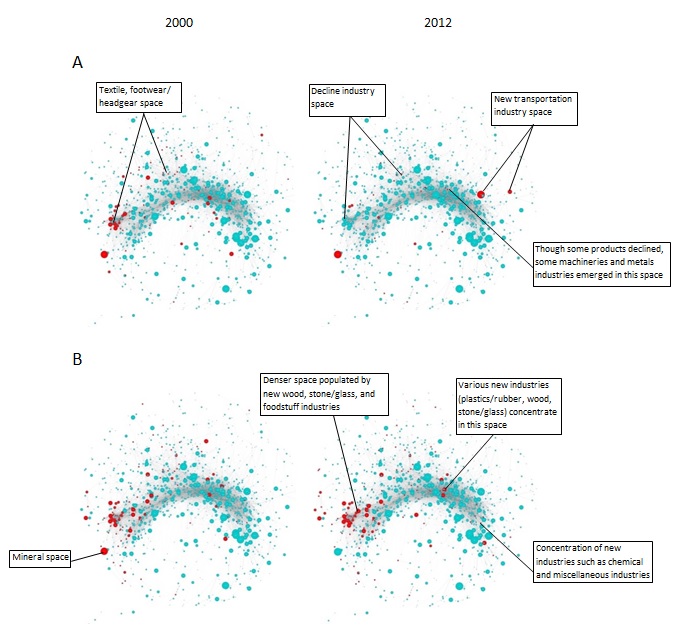
The two provinces’ product spaces above offer overviews about two different paths of regional industry development. In 2000, both West Java and Central Java have distinguished comparative advantage in textile, footwear and headgear products. In 2012, West Java loses its comparative advantages in the textile products and also in many other products, while Central Java successfully maintains its dominance in those products. West Java however, manages to develop a promising new transportation product in 2012 that seems to have weak relatedness to its product space structure in 2000. Similarly, Central Java also introduces some new products such as plastics/rubber, wood, stone/glass, chemical, and miscellaneous products in its 2012 product space, but, unlike West Java, the new products seem to be closely related to its 2000 product space.
Simulating the evolution of regional industry
One may ask whether there is a threshold for proximity that provinces should afford to be able to go through the industrialization process. If all provinces can develop new products regardless the proximity of the products to their current productive structure, logically after a certain period of time all provinces will gradually be able to develop all products in the product space. If that is the case, traditional economic theory is not incorrect that in the end provinces will converge eventually. In fact, the persistent differences in welfare across provinces and even across countries imply that something structural and non-tradable must be influencing the development of new products that motivates the idea of threshold.
In addressing this inquiry, a series of simulations has been run using various proximity values as threshold. By gradually increasing the proximity values it is expected to arrive at ‘threshold’ value. The results are displayed in Figure 4.4 and suggest two important things. First, there is a certain threshold for proximity to be met for new industries to emerge, and in the case of West Java and Central Java the value would be ɸ0.60. At lower proximity value (<ɸ0.60) both provinces manage to reach the sophisticated area at the core of the product space. Interestingly, at proximity ɸ0.60, West Java still manages to diverse its industries up to seven stages and populates the core of the product space. Second, regions that fail to meet this threshold cannot develop new products and tend to get lock-in in old and probably declining products, leaving these provinces behind. In the simulation, when the proximity was set at ɸ0.60 Central Java fails to develop new products and stops at the fifth stage of simulations. Increasing further the proximity threshold up to ɸ0.65[1], both provinces get stuck at where they are. If that is the case, provinces that endowed with diverse product structures would be obviously in great advantages to find nearby products that meet the threshold than regions that start with sparse product structures. These two factors, i.e. current product structures and proximity threshold, may explain why provinces evolve toward different development paths.
Transformation Simulation
for West Java and Central Java’s Product Spaces


[1] Using cross-country analyses Hidalgo et al. (2007) find that the threshold for countries to be able to converge with industrialized countries is at a proximity level greater than ɸ 0.65.
